I ran into a post on the Tar Heel Blog (THB) that talks about the Tar Heel’s home court advantage in recent years. Since it’s been a while since I wrote anything about UNCMBB, I thought it’d be a great topic to write on here too, looking at how great the teams have played on home court1 in recent years. And maybe I’ll look at how Duke has played on their home court too during the same time period just because.
THB counted the wins and losses in the past 3 years in particular, and that gave me a starting point.
| Season | Where | wins | losses |
|---|---|---|---|
| 2016 | H | 15 | 1 |
| 2017 | H | 16 | 0 |
| 2018 | H | 12 | 3 |
So it seems my count and their count matches. Then I was curious if this last 3 years have been the best there is, in terms of fewest losses, and for that matter, most wins, and best winning percentage at home. In below charts, season is the starting season of the 3 years. E.g., for season = 2016, value = 4 means, rolling 3 years loss count for 2016, 2017, and 2018 seasons. Championship seasons are represented with larger dots, and the latest 3 year statistics (wins, losses, and winning percentages) with coloured horizontal lines.
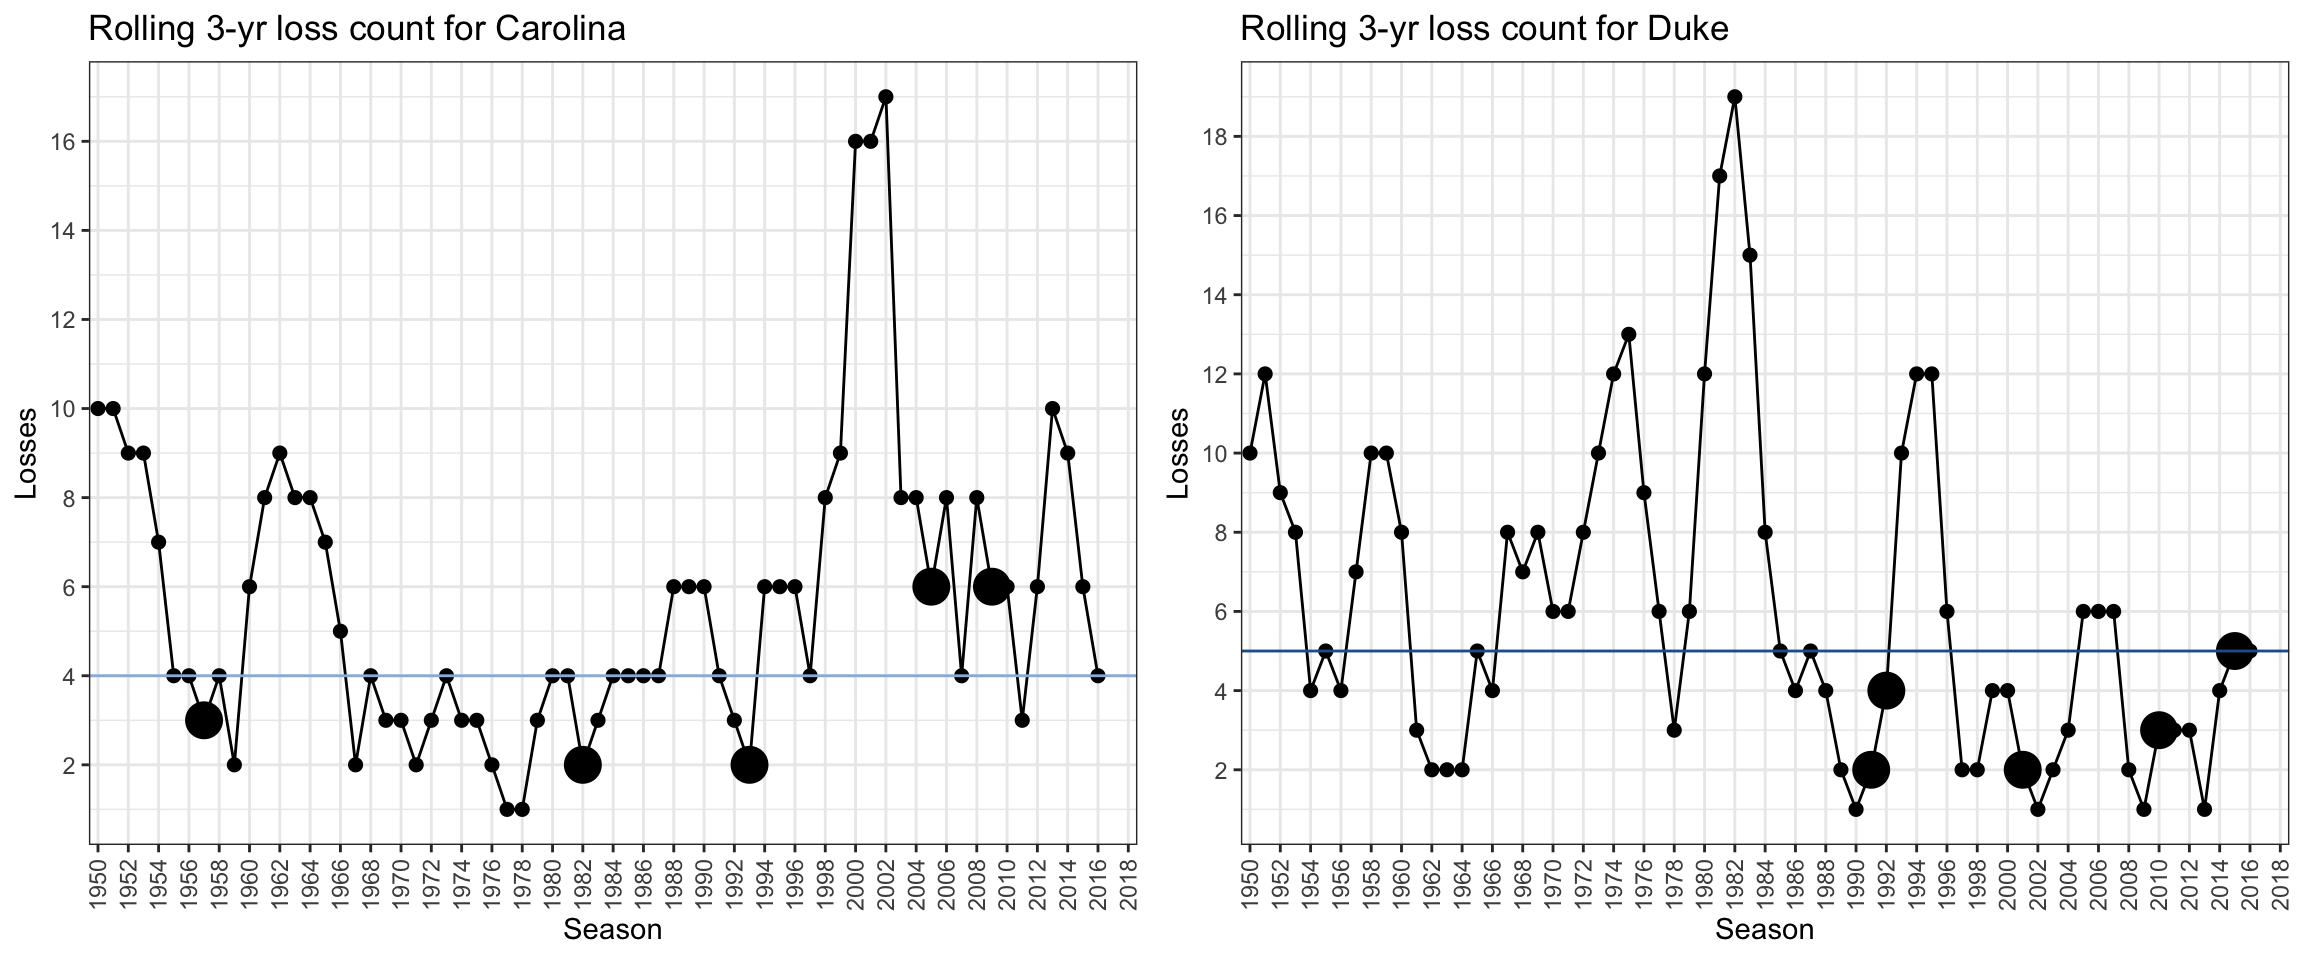
Although this past 3 years loss count (4) is a great feat, it’s not the best there is, it turns out, and there’s been 18 instances with fewer than 4 loss count. Three early championship seasons (1957, 1982, and 1983) stand out with 3 or fewer losses each (again, as the starting season of the next 3 seasons), with the next two championship seasons (2005 and 2009) not so superb loss counts at 6 apiece2.
The fewest 3-yr rolling home loss counts came in two separate instances, with a single lose apiece: 1977/1978/1979 seasons and 1978/1979/1980 seasons. Let’s see what those losses were.
| Season | Game_Date | Game_Day | Type | Where | Opponent_School | Result | Tm | Opp | OT |
|---|---|---|---|---|---|---|---|---|---|
| 1977 | 1977-01-26 | Wed | REG | H | Wake Forest | L | 66 | 67 | NA |
| 1980 | 1980-01-20 | Sun | REG | H | Maryland | L | 86 | 92 | NA |
Nothing stands out at me right away about Carolina’s 1977 - 1980 teams3, let alone 1977 Wake Forest and 1980 Maryland, but it must have been fantastic home court winning streaks for the Tar Heels. Below shows the 3-yr rolling win counts.
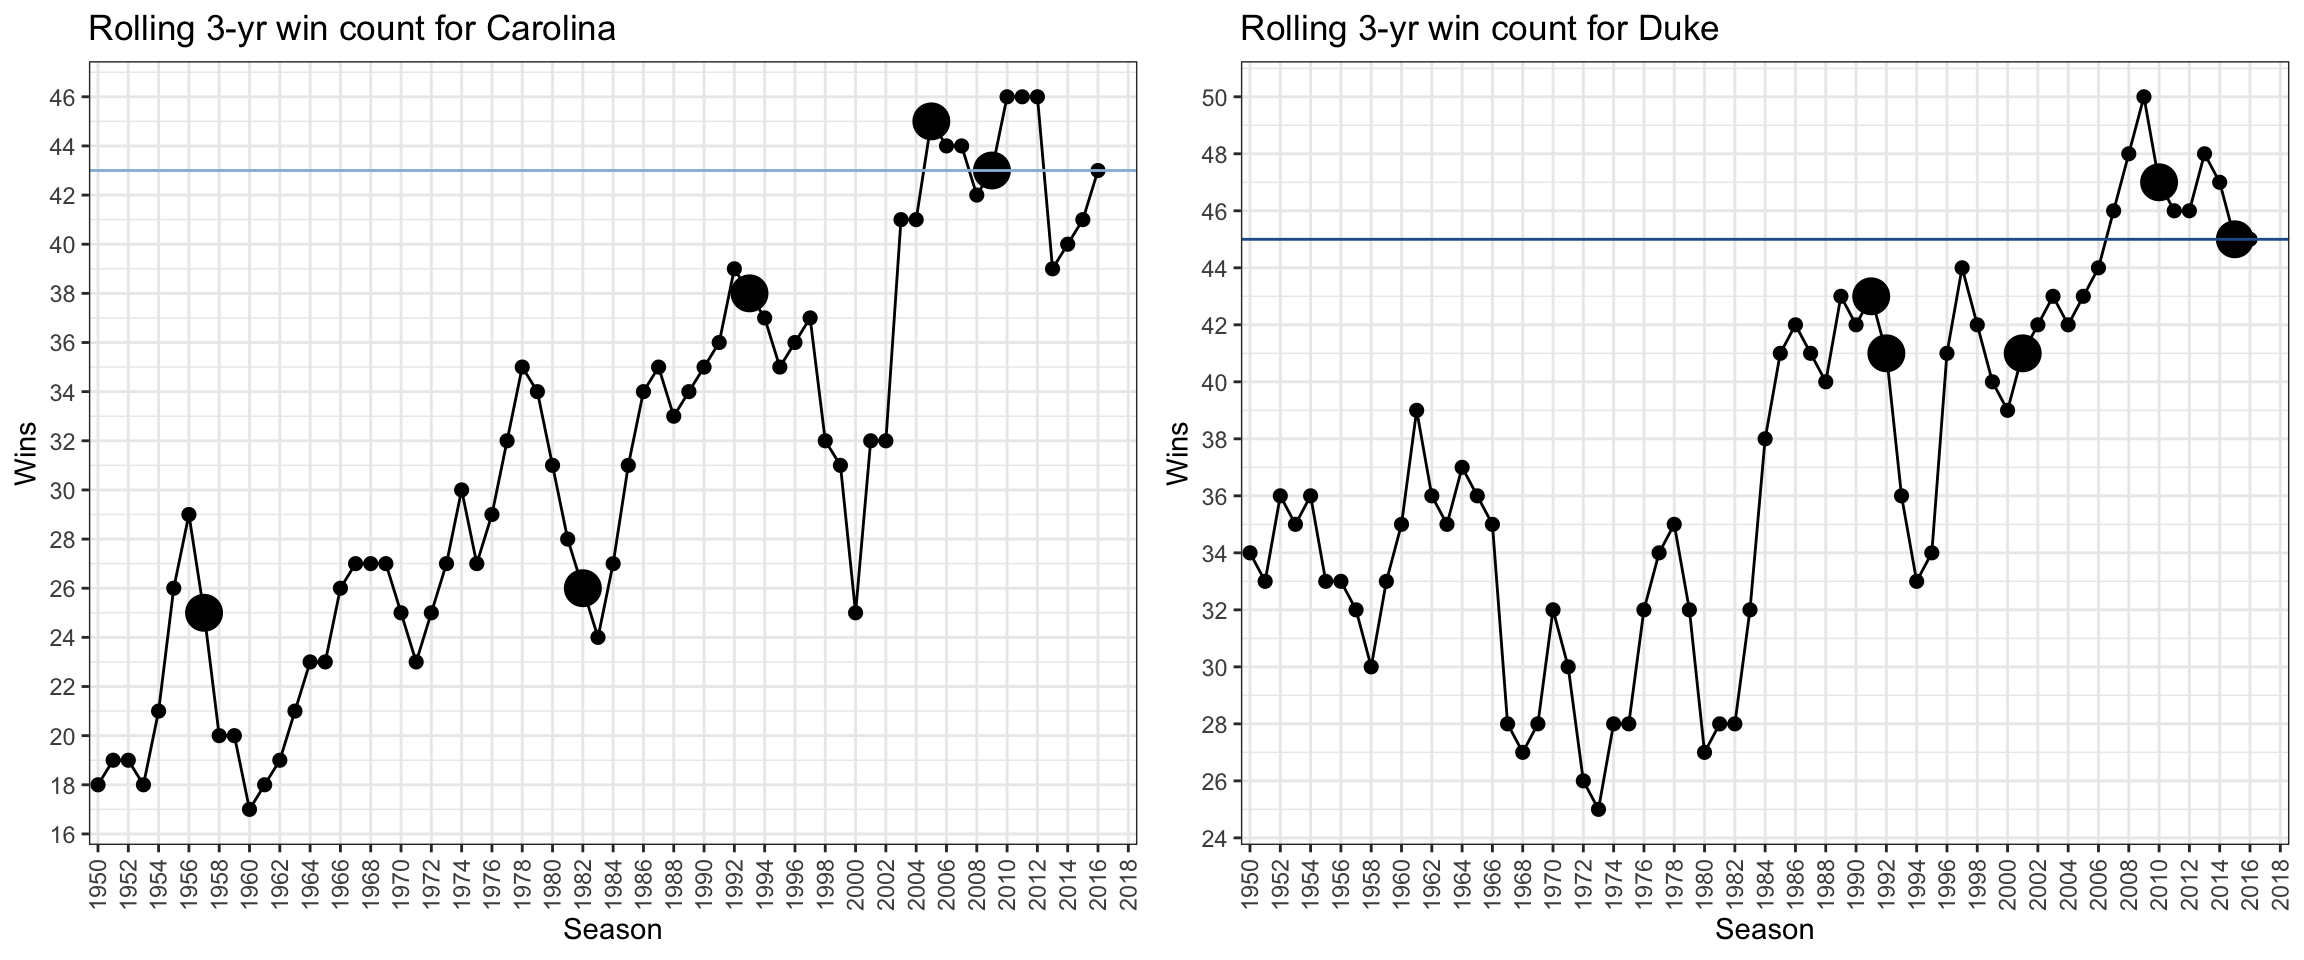
Sure, 1977 to 1979 seasons show great home winning trends at the time (e.g., 35 home wins during 3 seasons starting from 1978 season was the most in UNC history4 at the time), but the number of games played are somewhat different year after year, so let’s look at the winning percentage instead.
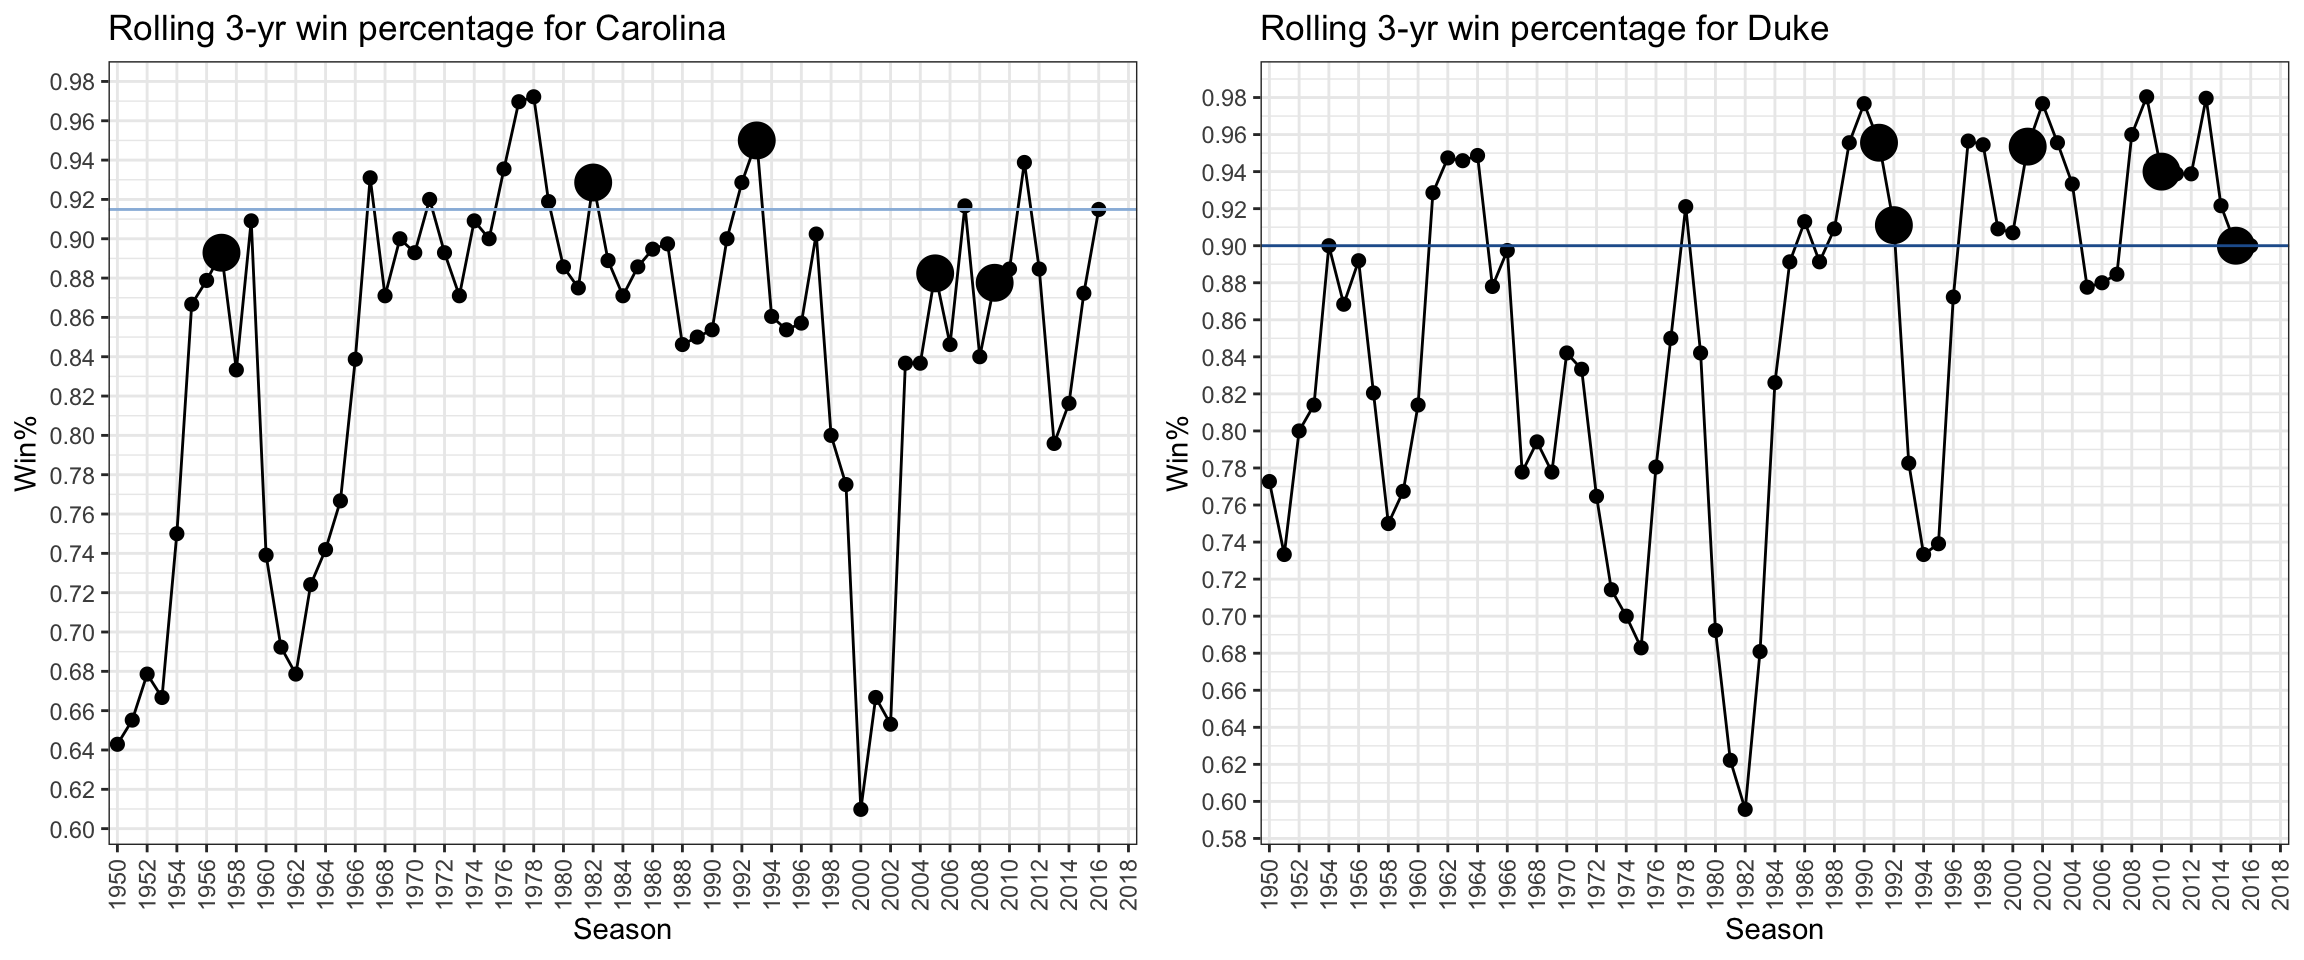
Yet again, 3 years following 1977 and 1978 seasons showed the highest rolling 3-yr home winning percentages, so it must have been really fun watching Carolina playing and winning at home those days. I feel like I have some homework to do, getting to know them a little better.
Now that I’ve looked at a couple of statistics for rolling 3 years, I became curious which freshman class has the bragging rights in terms of fewest losses, most wins, and highest winning percentage over their college carrers at home court. This should be pretty straightforward since a typical college career lasts for 4 years, which means all I have to change is the number of rolling years from 3 to 4. Below charts show the rolling 4-yr losses, wins, and win percentages, respectively.
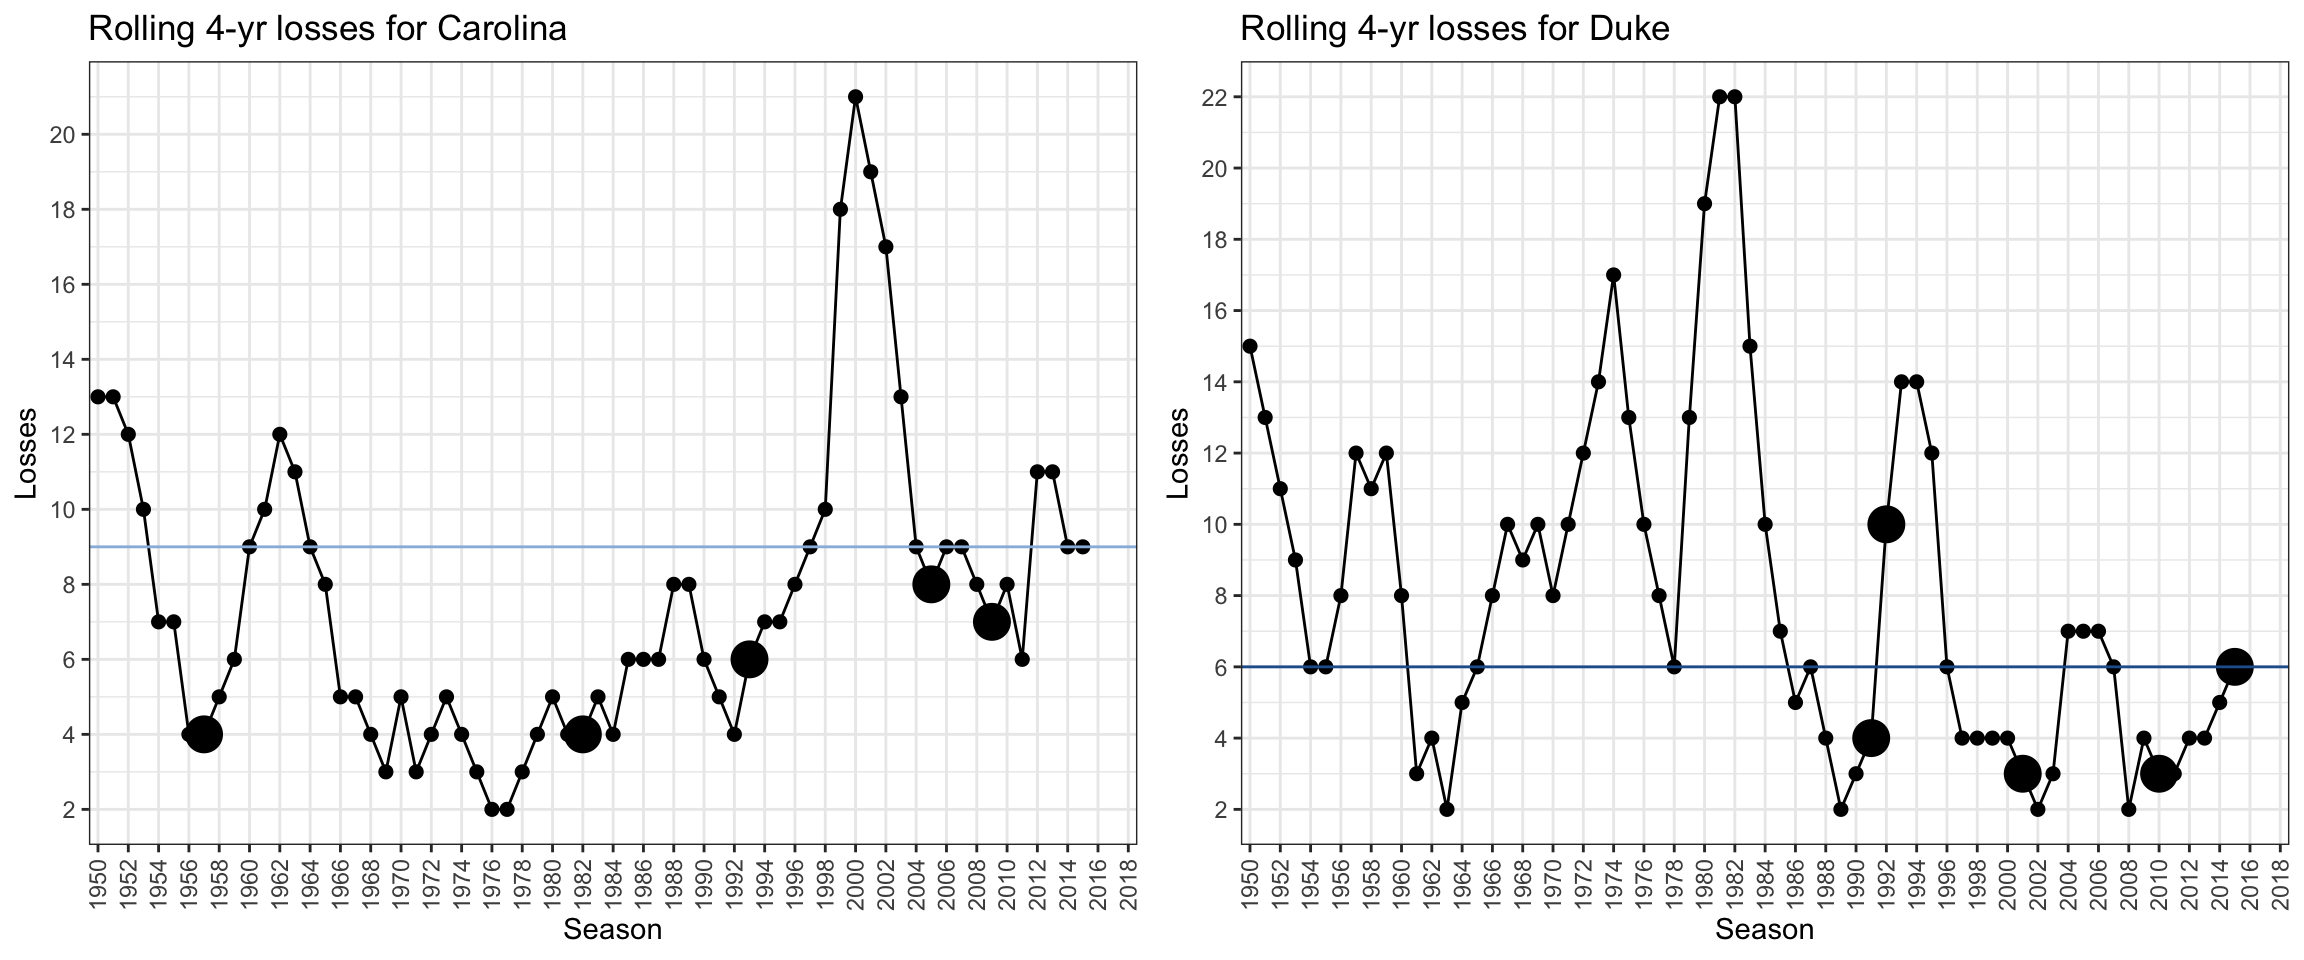
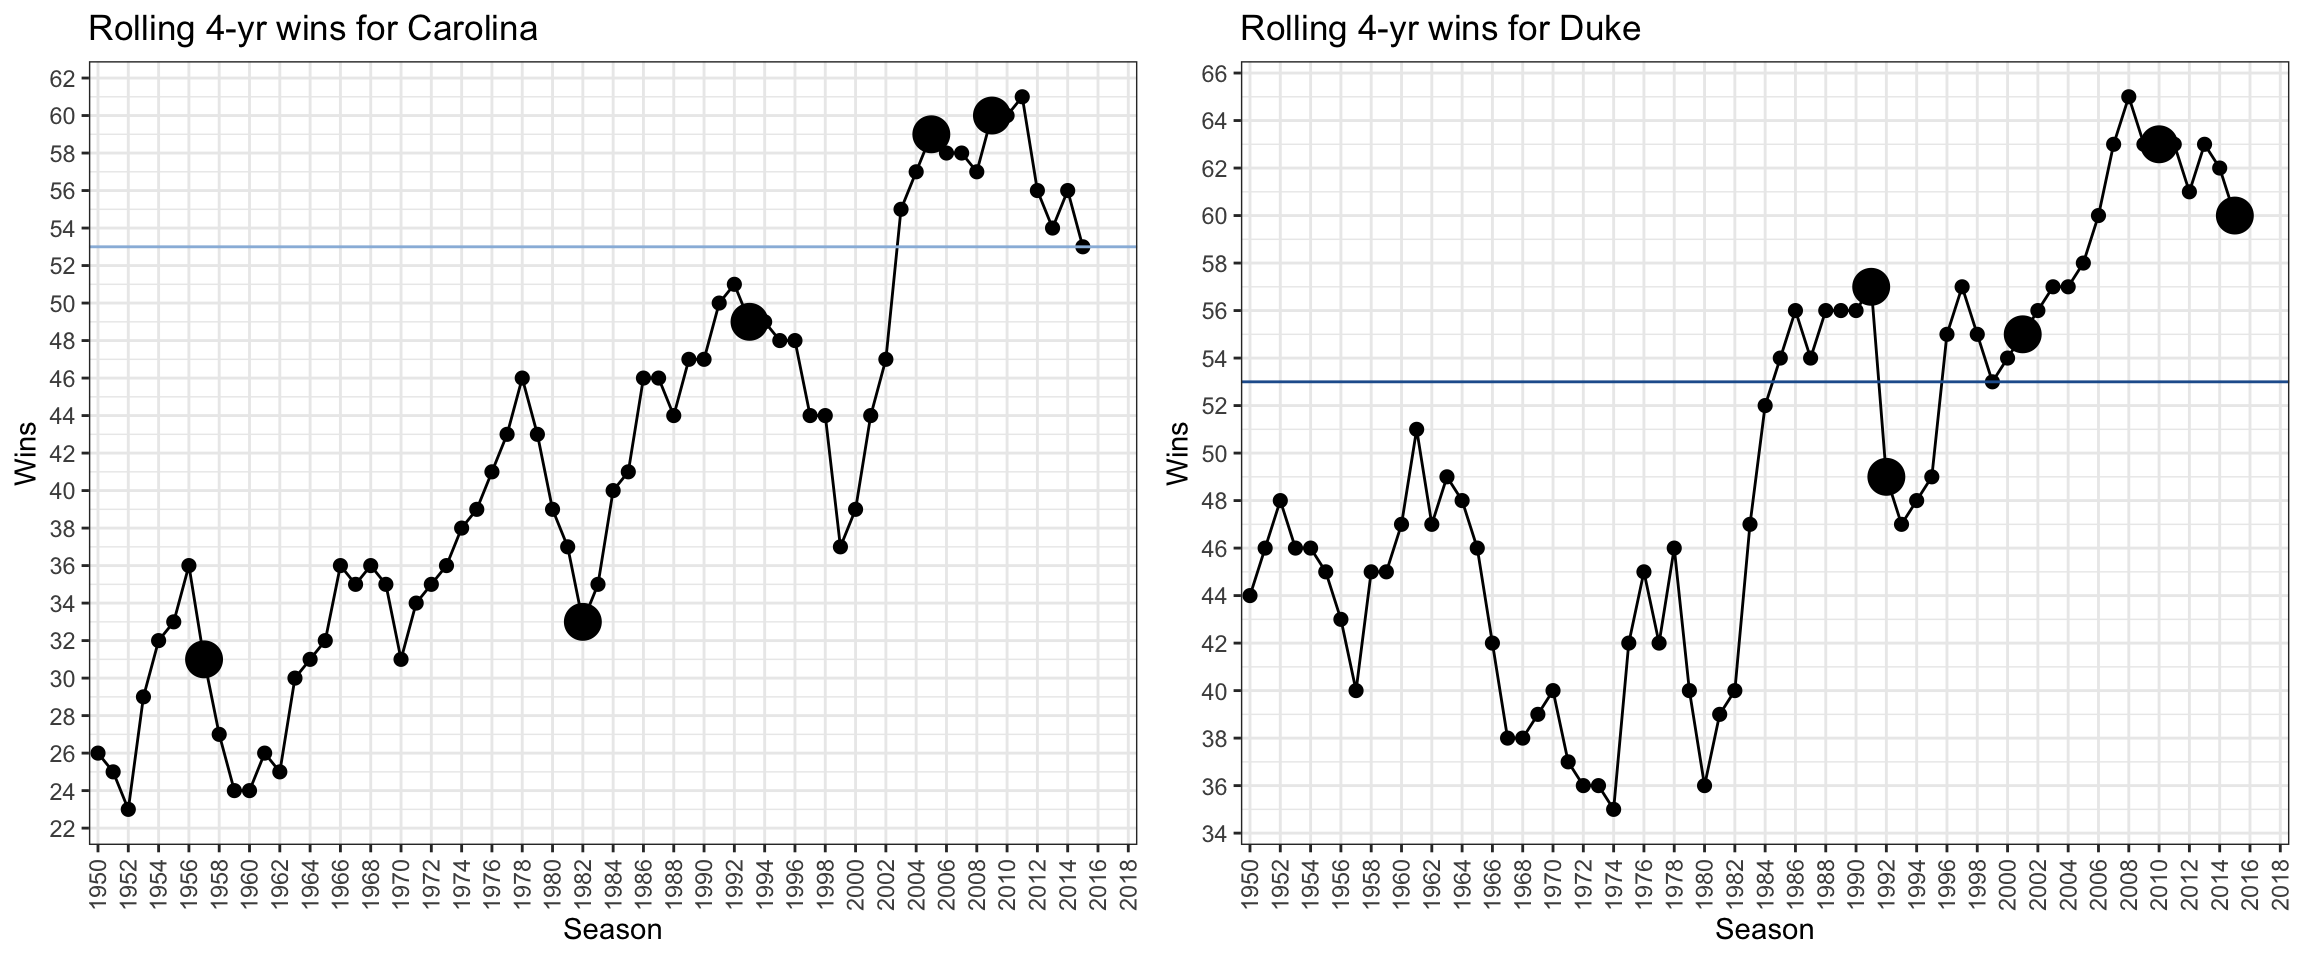
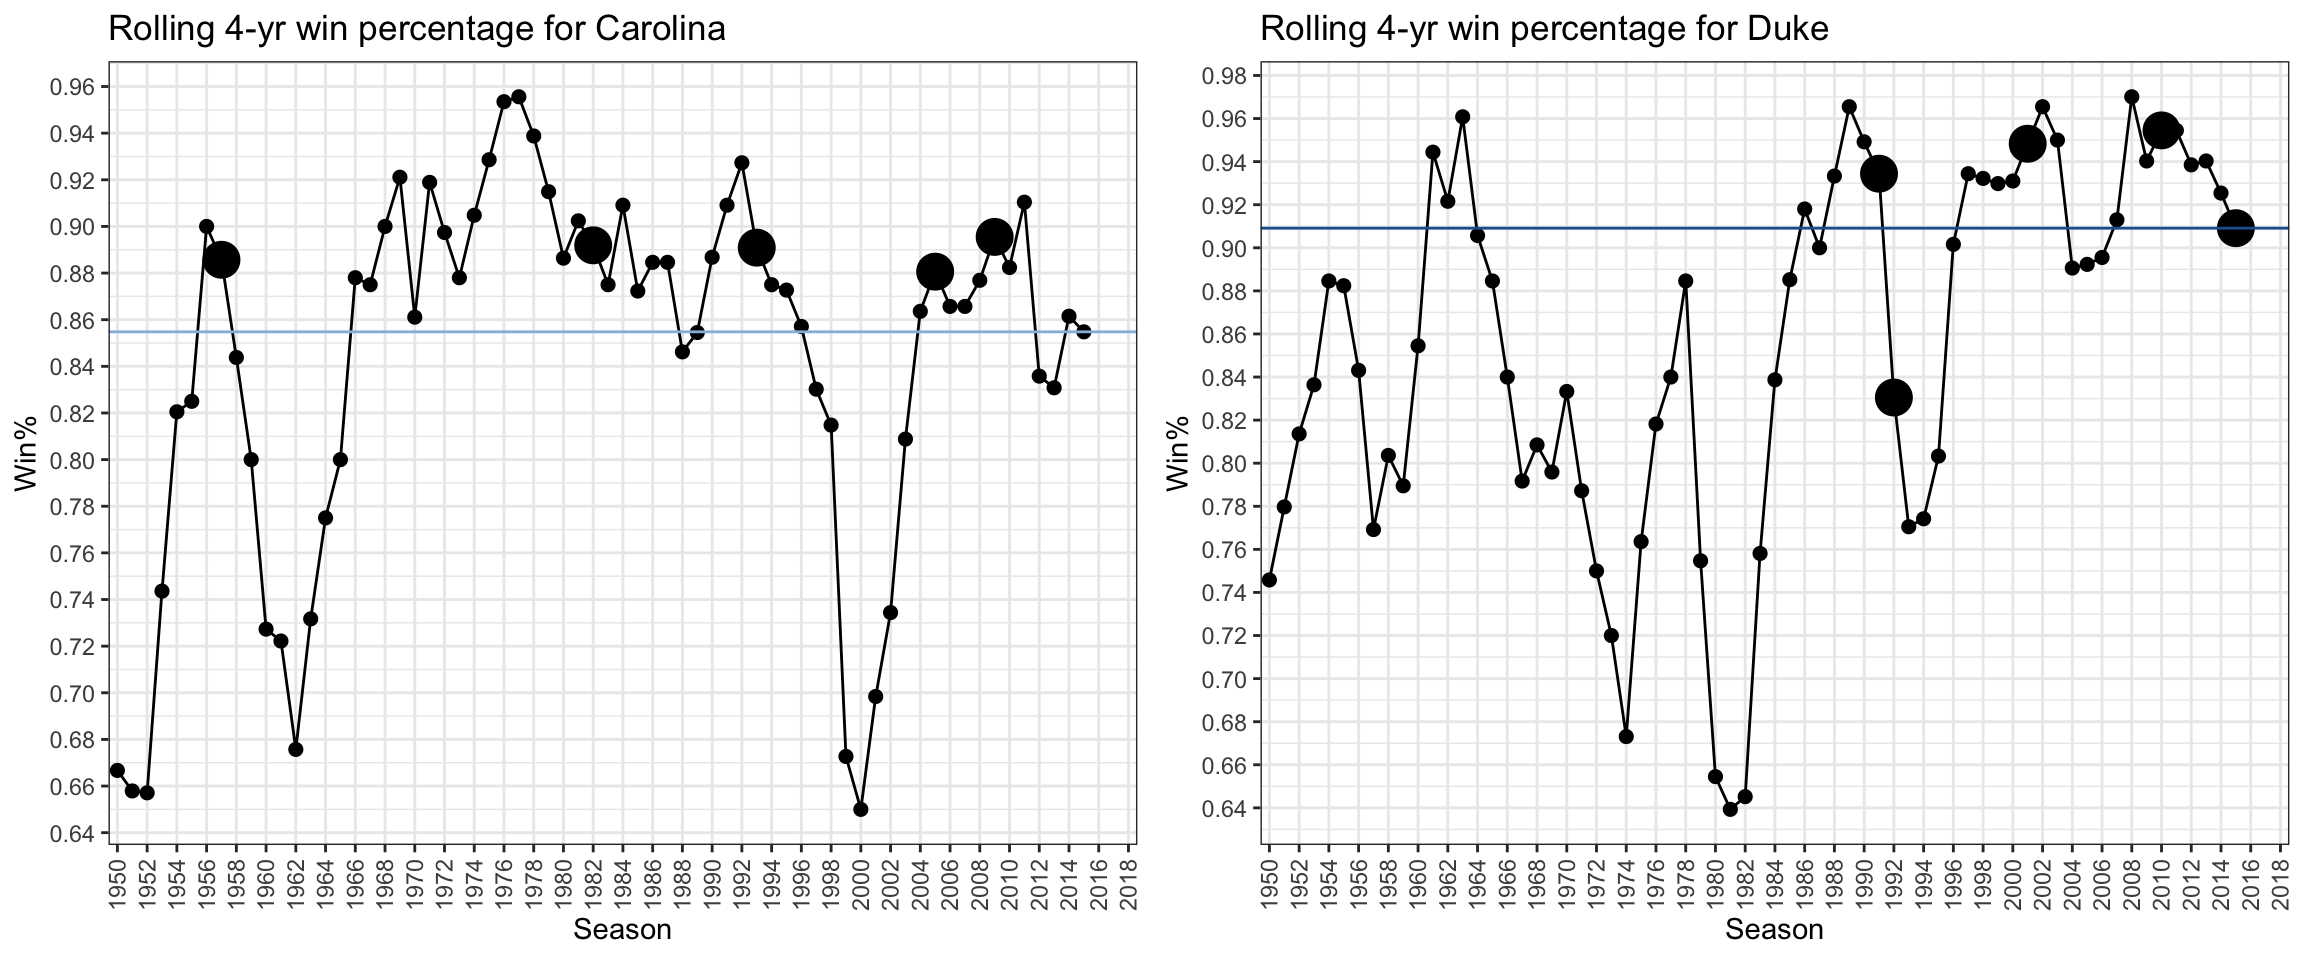
For Carolina, it seems the bragging rights go to the freshman classes in the late 70s whereas for Duke, they could go to any of the teams in the late 80s, early and late 2000s. I had expected Psycho-T’s 2005 freshman class to stand out in any of the three numbers, but to my surprise the class wasn’t the top although they were close especially in terms of rolling 4-yr wins. That got me thinking, maybe they did much better in away games (after all, that class never lost to Duke on their home court during their college careers), and that’s what I’ll be looking at next time.