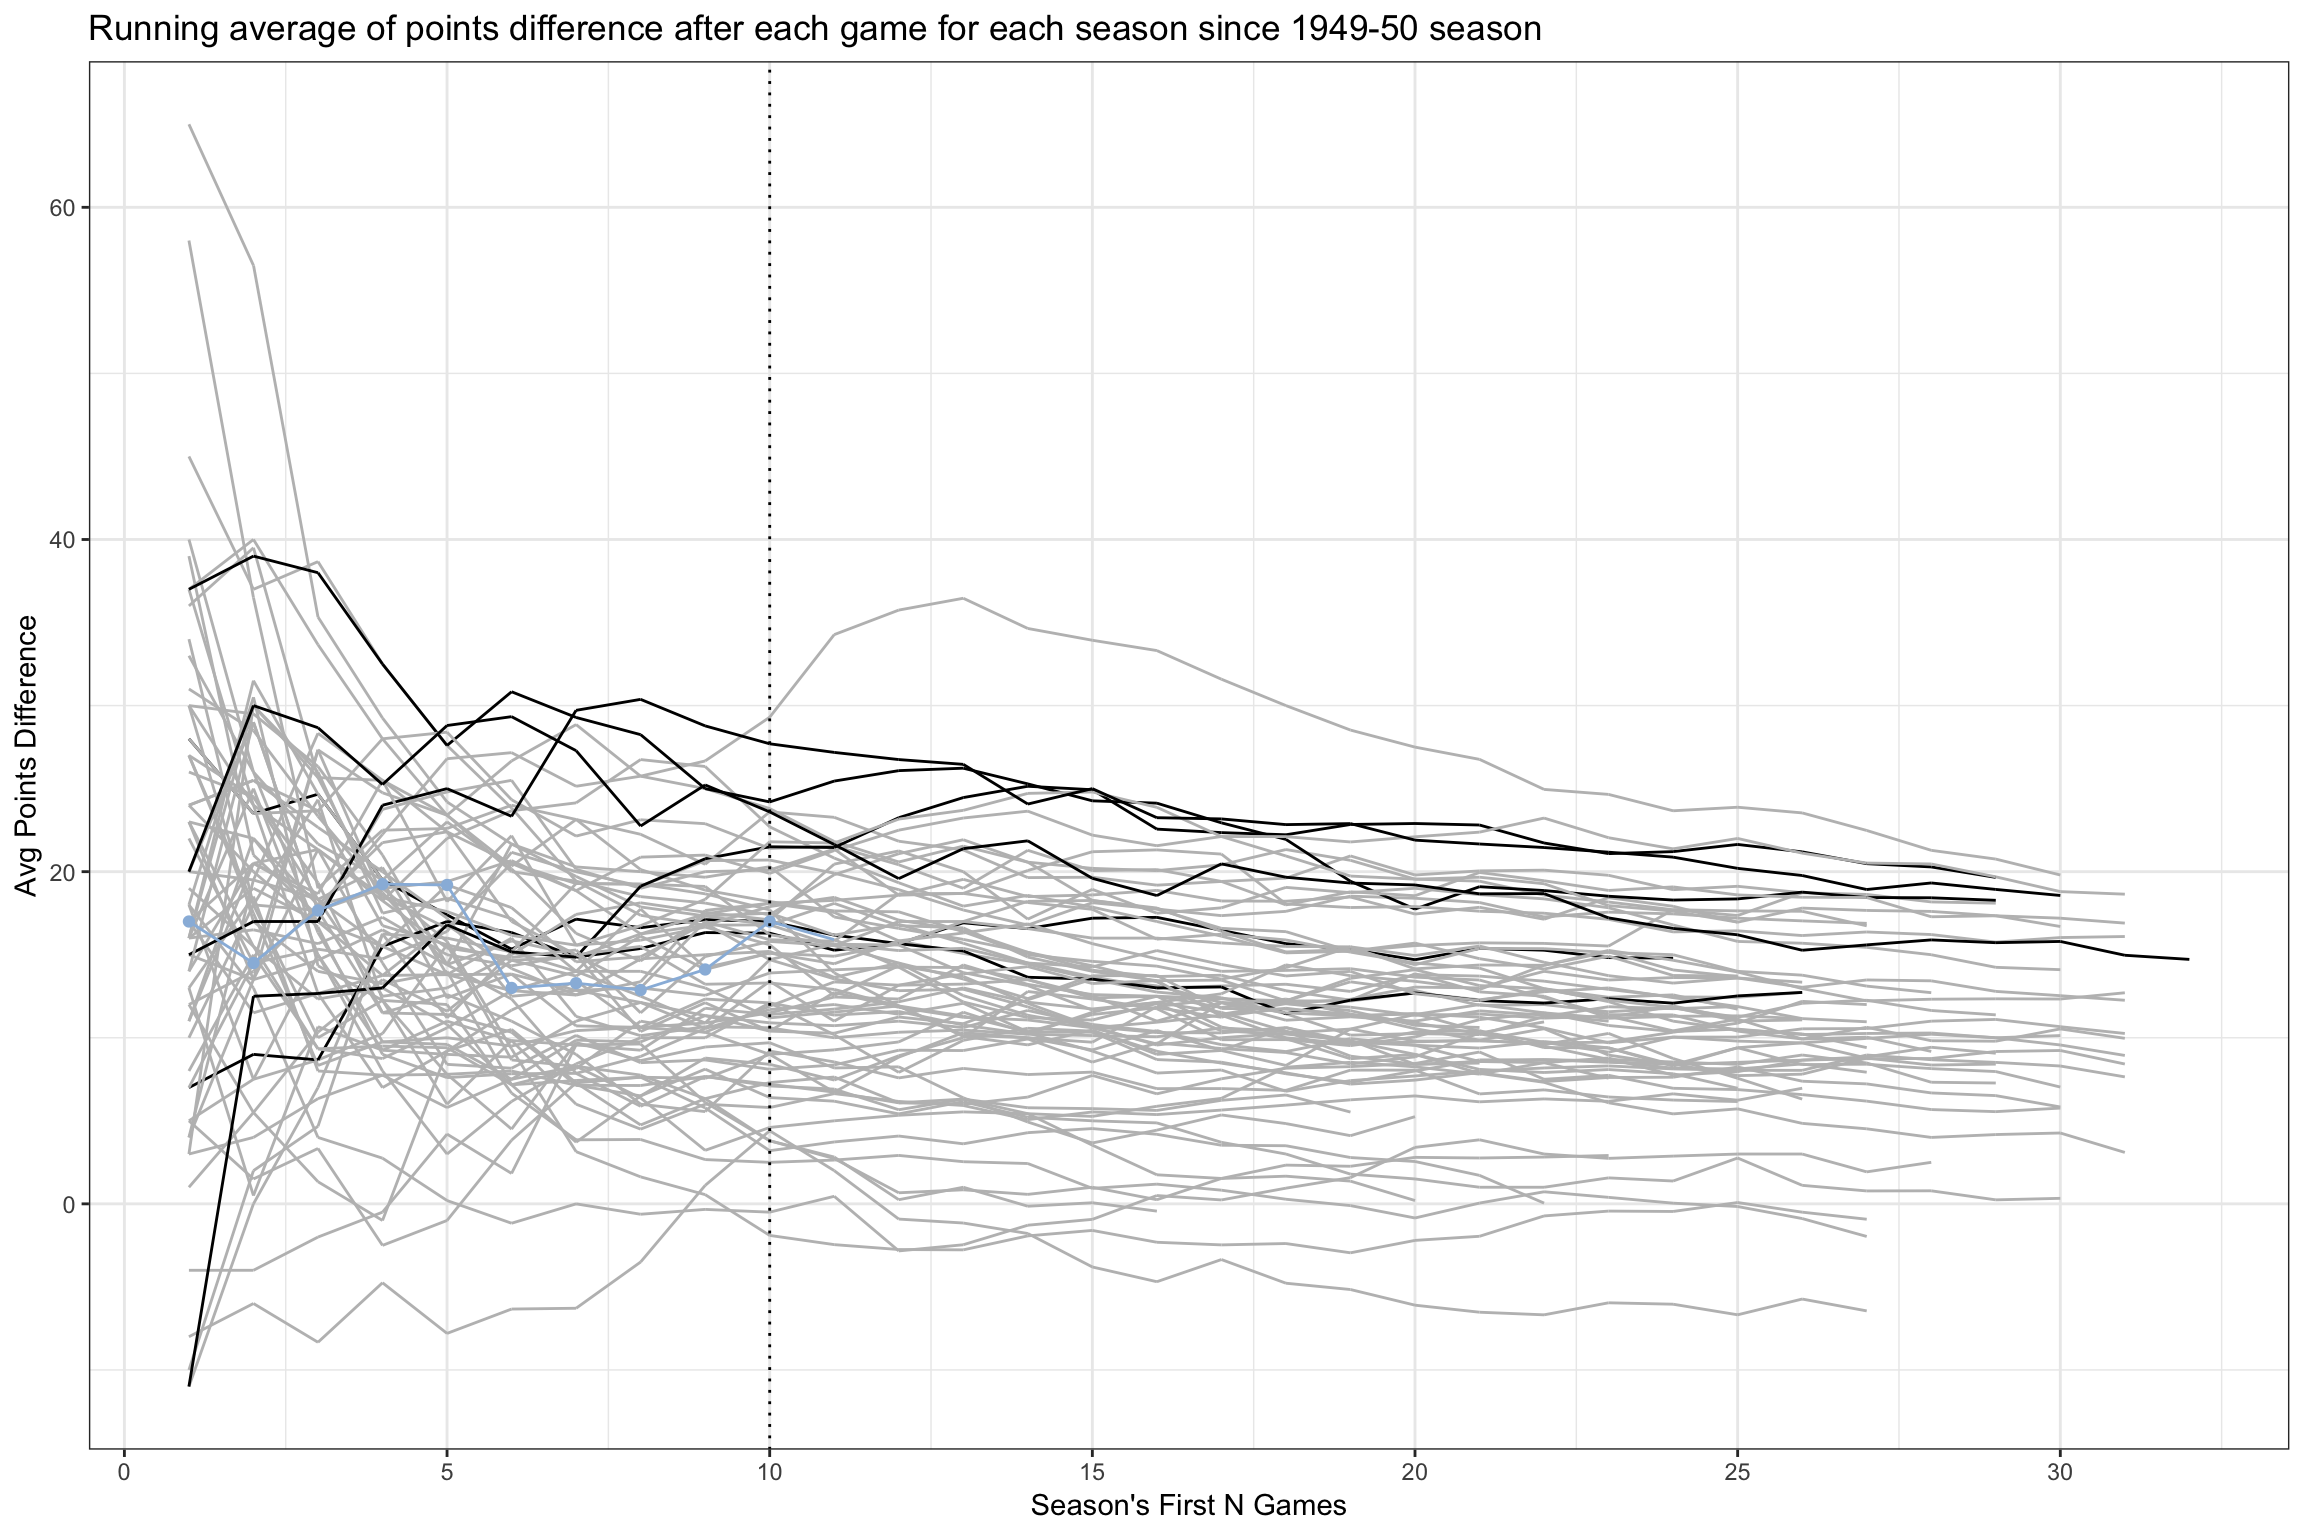
A quick update to the last post, where I looked at the (running) average of points difference through first 5 games then. 5 more games were played since then, so let’s look at the running average of points difference through the season’s first 10 games. All I have to do was to change the current number of game (from 5 to 10) and re-run the script.
| Rank | Season | Opponent | Tm | Opp | Avg_Diff |
|---|---|---|---|---|---|
| 24 | 2018 | Western Carolina | 104 | 61 | 17 |
| 25 | 2018 | Western Carolina | 104 | 61 | 17 |
The impact of the first loss of the season to Spartans is evident, as the running average dropped significantly from the 5th to the 6th game, which was the lost game. With the last game win against Western Carolina, the running average gained a good momentum, and the average through the season’s first 10 games sits at 24 out of 69 seasons since 1949-50 season.
Just for fun, let’s see how bad the loss was in terms of its impact to the running average since 1949-50 season.
| Season | Opponent_School | Tm | Opp | diffavg | diffavg_prev1 | delta_p1 |
|---|---|---|---|---|---|---|
| 1965 | Indiana | 81 | 107 | 8.666667 | 15.6 | -6.933333 |
| 2003 | Illinois | 65 | 92 | 7.166667 | 14.0 | -6.833333 |
| 1951 | Eastern Kentucky | 62 | 85 | 9.333333 | 15.8 | -6.466667 |
| 2018 | Michigan State | 45 | 63 | 13.000000 | 19.2 | -6.200000 |
| 2018 | Michigan State (4) | 45 | 63 | 13.000000 | 19.2 | -6.200000 |
So the loss to Spartans was one of the worst, measured by the changes to the points difference running average between 5th and 6th games, dropping the season average by more than 6 points. It’s probably not the most interesting number to quote to gauge how bad the game actually was, and many historic (and more intereting) low records have been already covered for the game.
Good news is that the running average is increaing sharply after a trio of relatively on-par performances since the loss until the Western Carolina game, in which we played so well that many historic high records have been produced.