Time flies, and the Tar Heels played the season’s first 5 games already. And loosely speaking, they’ve played well so far (knocking on woods), to the eyes of just another casual fan here!
I’m not going to say anything about this season’s fate based on the results of the season’s first 5 games, but still I was curious how well this season compares to other seasons at this point. There could be many different ways to do just that, but I thought looking at each season’s running average of points difference after each regular season game might be interesting.
Looking through the 5th game of each season, the current season sits at 19th out of total 69 seasons since 1949-50 campaign as it shows in the next table. Also note that 3 of the top 6 seasons in the table (2017, 1993, and 2009) were championship winning seasons.
| Rank | Season | Opponent | Tm | Opp | Avg_Diff |
|---|---|---|---|---|---|
| 1 | 2017 | Chaminade | 104 | 61 | 28.8 |
| 2 | 1998 | Seton Hall | 95 | 65 | 28.4 |
| 3 | 1973 | Kentucky | 78 | 70 | 27.6 |
| 4 | 1993 | Houston | 84 | 76 | 27.6 |
| 5 | 1987 | Miami | 122 | 77 | 26.8 |
| 6 | 2009 | Oregon | 98 | 69 | 25.0 |
| 7 | 1992 | Seton Hall | 83 | 54 | 24.8 |
| 8 | 1970 | Virginia | 80 | 76 | 24.2 |
| 9 | 1974 | East Tennessee State | 81 | 63 | 23.4 |
| 10 | 1986 | Nevada-Las Vegas | 65 | 60 | 23.4 |
| 11 | 1991 | Connecticut | 79 | 64 | 23.4 |
| 12 | 1976 | East Tennessee State | 104 | 67 | 23.0 |
| 13 | 1972 | Wake Forest | 99 | 76 | 22.6 |
| 14 | 2008 | Brigham Young | 73 | 63 | 22.4 |
| 15 | 2012 | South Carolina | 87 | 62 | 22.4 |
| 16 | 1967 | New York University | 95 | 58 | 22.0 |
| 17 | 1969 | Clemson | 90 | 69 | 19.4 |
| 18 | 2004 | George Mason | 115 | 81 | 19.2 |
| 19 | 2018 | Arkansas | 87 | 68 | 19.2 |
| 20 | 2018 | Arkansas | 87 | 68 | 19.2 |
When we look at the running average of points difference each season, it seems to be stablizing after first couple of games each season. Maybe it’s after the first 5 games, or maybe it’s after the beginning of the conference games, but regardless, considering first few games each season are usually “easier” than later games, that observation seems to make sense.
I tried to distinguish three different types of seasons in the plot: (1) 6 NCAA championship winning seasons (in black), (2) current season (in carolin blue), and (3) all the other seasons (in grey).
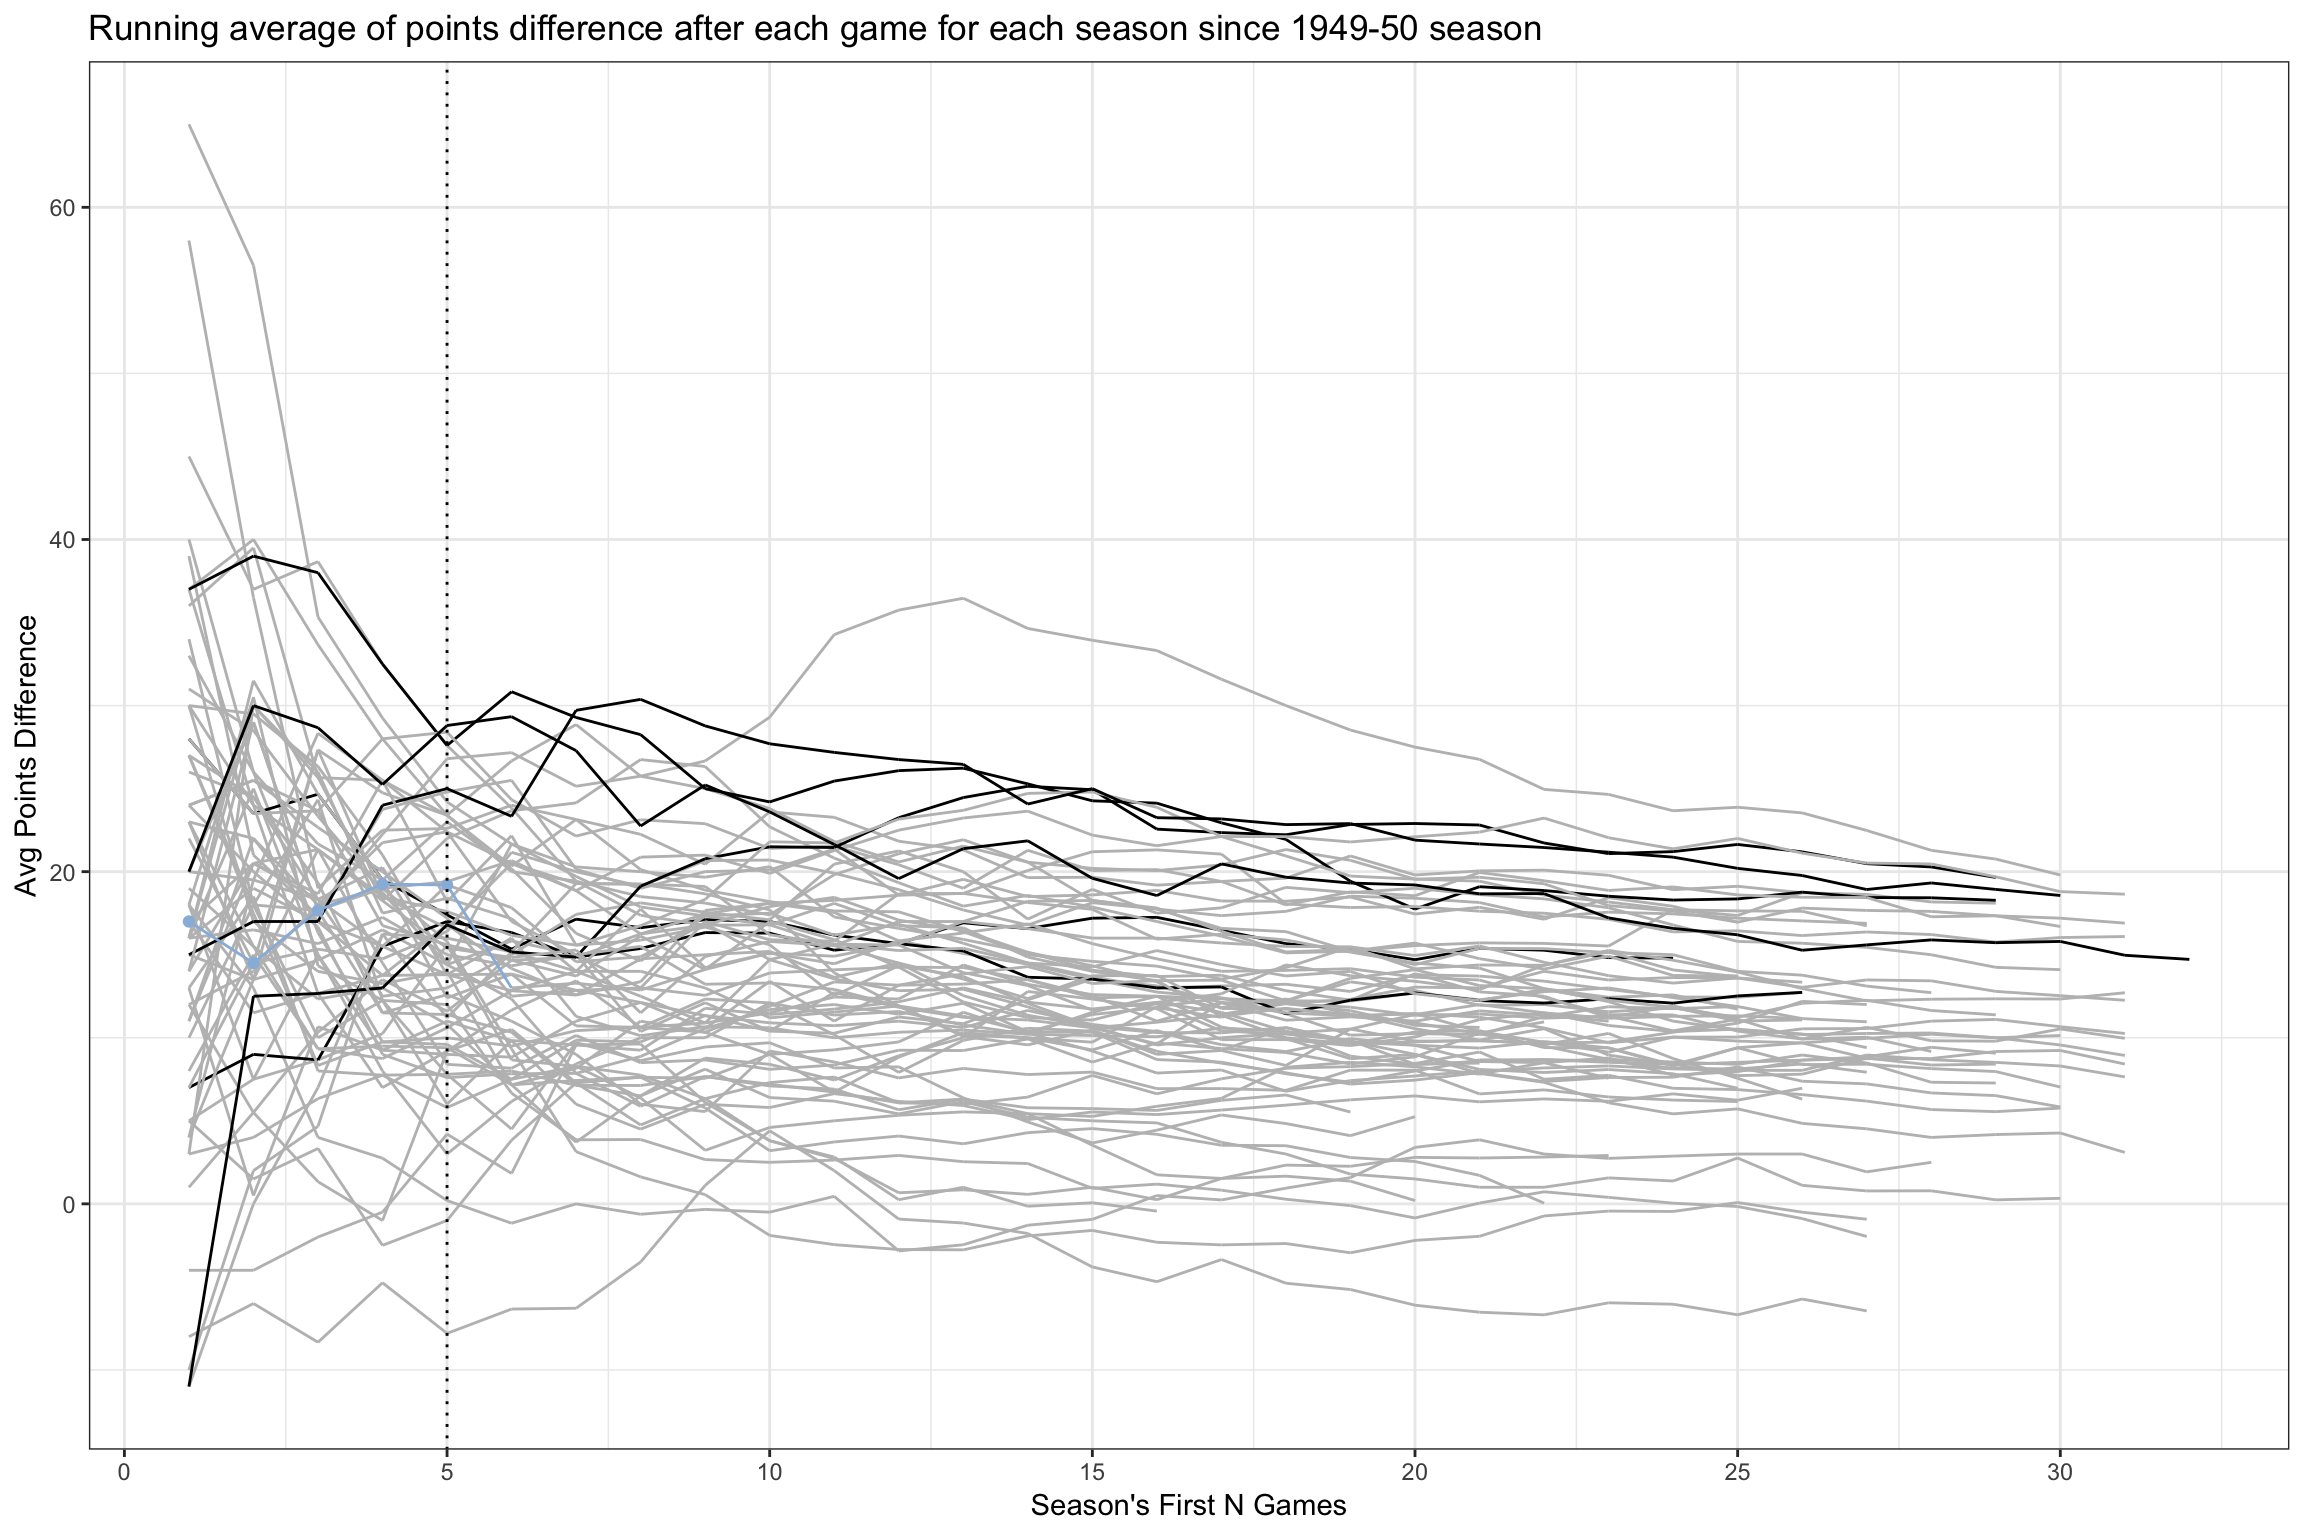
And what’s with that high flying season in grey that had average points difference of 30+ through the first 15 games ?
| Rank | Season | Opponent | Tm | Opp | Avg_Diff |
|---|---|---|---|---|---|
| 1 | 1986 | Fordham | 92 | 68 | 33.93333 |
| 2 | 2009 | College of Charleston | 108 | 70 | 25.00000 |
| 3 | 2005 | Georgia Tech | 91 | 69 | 24.93333 |
| 4 | 2007 | Florida State | 84 | 58 | 24.80000 |
| 5 | 1993 | Clemson | 82 | 72 | 24.26667 |
It turns out it was the 1985-86 season, and it must have been a somewhat disappointing season without the championship trophy after blazing through opponents early in the season. Seems like their last game was against U of L.
| Season | Game_Date | Type | Where | Opponent_School | Result | Tm | Opp |
|---|---|---|---|---|---|---|---|
| 1986 | 1985-11-24 | REG | H | UCLA | W | 107 | 70 |
| 1986 | 1985-11-25 | REG | H | Iona | W | 110 | 67 |
| 1986 | 1985-11-29 | REG | N | Missouri | W | 84 | 63 |
| 1986 | 1985-11-30 | REG | N | Purdue | W | 73 | 62 |
| 1986 | 1985-12-01 | REG | N | Nevada-Las Vegas | W | 65 | 60 |
| Season | Game_Date | Type | Where | Opponent_School | Result | Tm | Opp | |
|---|---|---|---|---|---|---|---|---|
| 30 | 1986 | 1986-03-02 | REG | A | Duke | L | 74 | 82 |
| 31 | 1986 | 1986-03-07 | CTOURN | H | Maryland | L | 75 | 85 |
| 32 | 1986 | 1986-03-13 | NCAA | N | Utah | W | 84 | 72 |
| 33 | 1986 | 1986-03-15 | NCAA | N | Alabama-Birmingham | W | 77 | 59 |
| 34 | 1986 | 1986-03-20 | NCAA | N | Louisville | L | 79 | 94 |
Next up Spartans! Go Heels!