This past week, I was in a presentation training, and all the participants had to select a topic on the last day of training to give a (perfect) 15-min presentation. You know, after learning all the essential presentation skills, it was time to apply those fancy skills to work!
I decided to talk about UNC MBB and its great stories behind each of the 3 championship seasons during Williams-era. I made a 5-page deck using Rmd-driven slidy presentation, and I am planning to post it here either in its raw form or after some adjustment using xaringan.
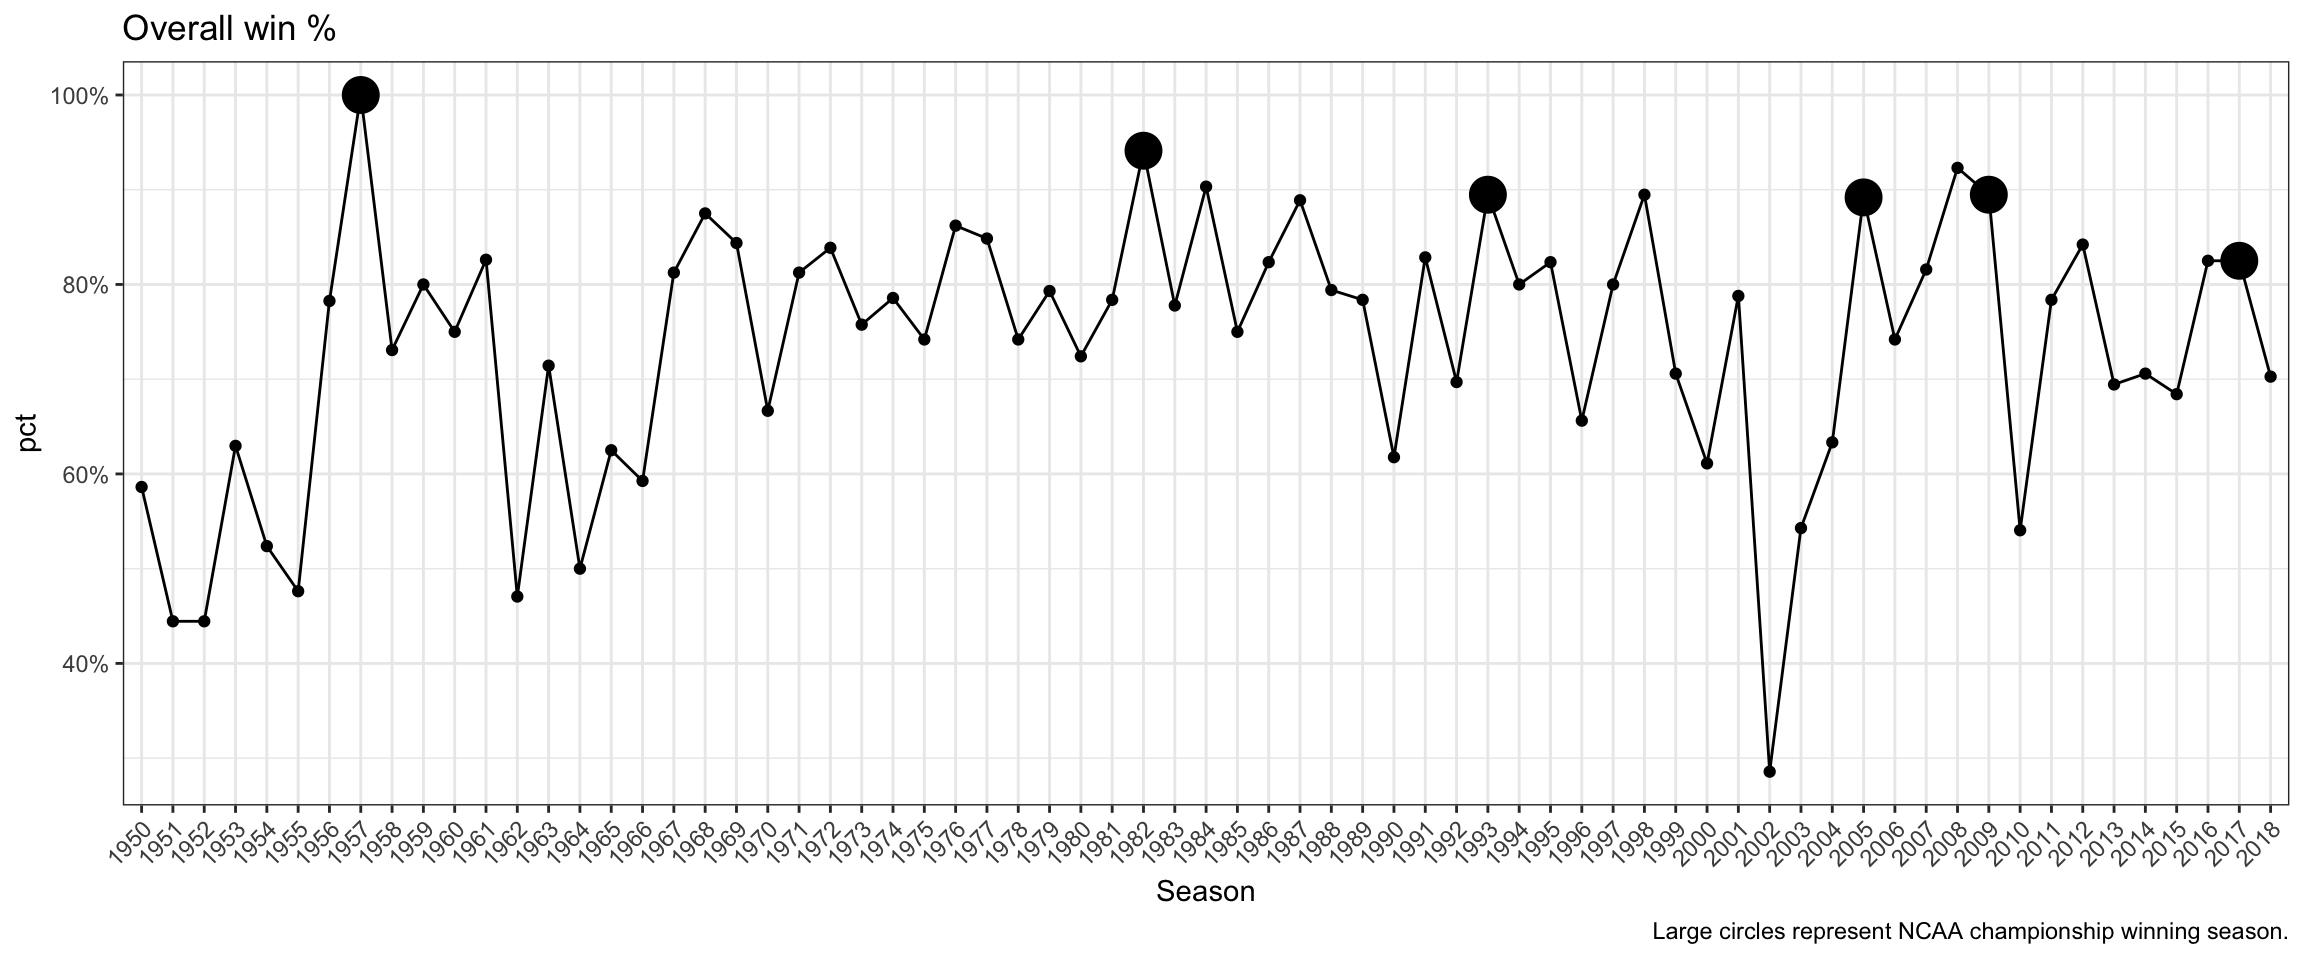
The main driver of the presentation was each season’s win percentage, including all match types (regular, conference tournament, and NCAA tournament) as so:
After I gave the final presentation, I realized that looking at regular season win % leading up to NCAA tournament might be also interesting, especially to say anything about each team’s performance during the regular season and its final result at NCAA tournament level. So I made a small change in my script, and below is the regular season win % since 1949-50 season.
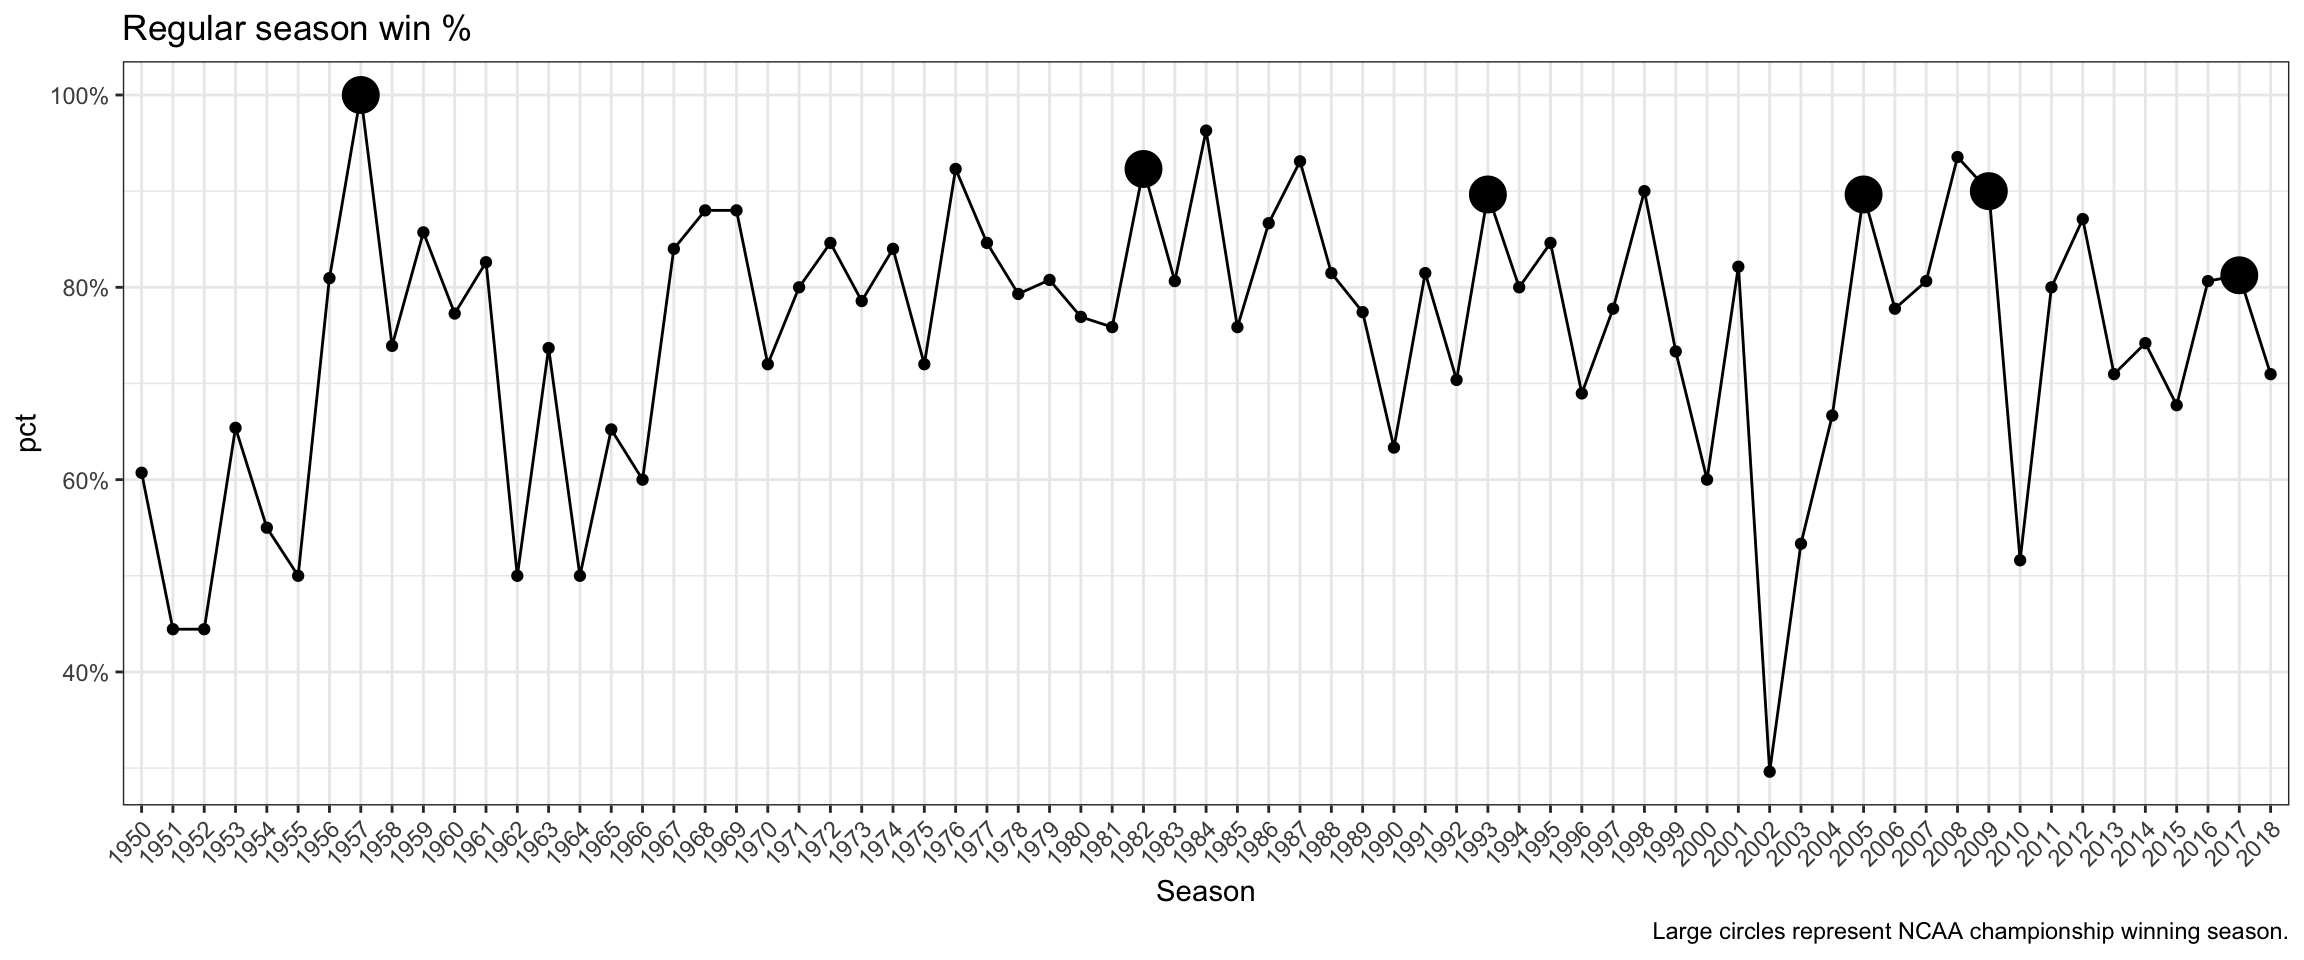
There goes the perfect championship winning season in 1956-57, Dean Smith’s first championship season in 1981-82, and his second one in 1992-93 season. And there goes Roy William’s first championship season in 2004-05, second one in 2008-09 season, and last but not least, his latest in 2016-17 season. (And yes I do see that horrible deep in early 2000s.)
There are also some seasons that had as much success as the crowning seasons in terms of regular season win %s but without bearing the NCAA championship trophy. Looking at the top 10 seasons by the regular season win % should make it easy to identify them:
| Season | games | wins | losses | pct | champ |
|---|---|---|---|---|---|
| 1957 | 24 | 24 | 0 | 1.0000000 | Yes |
| 1984 | 27 | 26 | 1 | 0.9629630 | No |
| 2008 | 31 | 29 | 2 | 0.9354839 | No |
| 1987 | 29 | 27 | 2 | 0.9310345 | No |
| 1976 | 26 | 24 | 2 | 0.9230769 | No |
| 1982 | 26 | 24 | 2 | 0.9230769 | Yes |
| 1998 | 30 | 27 | 3 | 0.9000000 | No |
| 2009 | 30 | 27 | 3 | 0.9000000 | Yes |
| 1993 | 29 | 26 | 3 | 0.8965517 | Yes |
| 2005 | 29 | 26 | 3 | 0.8965517 | Yes |
Interestingly, only (?) half of the top 10 seasons with highest win % ended up with NCAA championship. Other half not-so-fortunate seasons include some that I’m familiar with (such as 2008, 1998) and others that I’m not (such as 1984, 1987, and 1976). Having players data readily available for each season could’ve made it a breeze to look into those highly successful yet not so fortunate seasons, and it’s definitely something that I’d like to add to my data source.
Also notable is that not all the 6 NCAA championship winning seasons are included in the list of top 10 regular season win %. Turns out the latest crowning season is not part of this elite seasons, having lost 6 games in the regular season, a feat that is not indeed so elite compared to the 5 highly successful yet unforunate seasons from above.
| Season | games | wins | losses | pct | champ |
|---|---|---|---|---|---|
| 1957 | 24 | 24 | 0 | 1.0000000 | Yes |
| 1982 | 26 | 24 | 2 | 0.9230769 | Yes |
| 2009 | 30 | 27 | 3 | 0.9000000 | Yes |
| 1993 | 29 | 26 | 3 | 0.8965517 | Yes |
| 2005 | 29 | 26 | 3 | 0.8965517 | Yes |
| 2017 | 32 | 26 | 6 | 0.8125000 | Yes |
But between a highly successful regular season without trophy versus a lukewarm (I don’t know, is 26-6 a lukewarm season?) regular season with a trophy at the end? I’ll take the trophy day in and day out!